Showing posts with label IPCC. Show all posts

Wednesday, March 23, 2016

The fourth stumbling step

Thus far we have seen that carbon dioxide really is increasing in the atmosphere, and that the evidence that it originates from burning fossil fuels is good. However, in the third step, we found that the link between carbon dioxide in the atmosphere and global temperatures was tenuous at best, and certainly not at the level of understanding where anyone could say "We can control the global temperature rise to less than 2 degrees C by controlling carbon emissions!" They can't, and we will stop wasting money the sooner they realize the falsity of such a statement.

In this fourth step we examine what the climate effects of a warmer world might be.  First, what is “climate”? It is the result of averaging a climatological variable, such as rainfall or atmospheric pressure, measured typically over a month or a season, where the average is taken over several years so as to give an indication of the weather that might be expected at that month or season.

Secondly, we need to understand the meaning of “change”. In this context it clearly means that the average of a climatological variable over X number of years will differ from the same variable averaged over a different set of X years.  But it is readily observable that the weather changes from year to year, so there will be a natural variation in the climate from one period of X years to another period X years long.  One therefore needs to know how long X must be to determine the natural variability and thus to detect reliably any change in the measured climate.

This aspect of “climate change” appears to have been overlooked in all the debate about climate change.  It seems to be supposed that there was a “pre-industrial” climate, which was measured over a large number of years before industry became a significant factor in our existence, and that the climate we now observe is statistically different from that hypothetical climate.

The problem, of course, is that there is very little actual data from those pre-industrial days, so we have no means of knowing what the climate really was.  There is no baseline from which we can measure change. 

Faced by this difficulty, the proponents of climate change have modified the hypothesis. It is supposed that the observed warming of the earth will change the climate in such a way as to make extreme events more frequent. This does not alter the difficulty; in fact, it makes it worse.

To illustrate, assume that an extreme event is one that falls outside the 95% probability bounds. So in 100 years, one would expect 5 extreme events on average.  Rather than taking 100 years of data to obtain the average climate, there are now only 5 years to obtain an estimate of the average extreme event, and the relative error in averaging 5 variable events is obviously much larger than the relative error in averaging 100 variable events.

The rainfall data for England and Wales demonstrates this quite convincingly:-
The detrended data is close to normally distributed, so that it is quite reasonable to use normal statistics for this. The 5% limits are thus two standard deviations either side of the mean.  In the 250-year record, 12.5 extreme events (those outside the 95% bounds) would be expected.  In fact, there are 7 above the upper bound and 4 below the lower bound, or 11 in total. Thus it requires 250 years to get a reasonable estimate (within 12%) of just the frequency of extreme rainfall.  There is no possibility of detecting any change in this rate, as would be needed to demonstrate “climate change”.

Indeed, a human lifespan is insufficient even to detect the frequency of the extreme events.  In successive 60-year periods, there are 2, 4, 2 and 2 events, an average of 2.5 events with a standard deviation of 1.0. There is a 95% chance of seeing between 0.5 and 5.5 extreme events in 60 years, where 3 (5% of 60) are expected. Several lifetimes are necessary determine the frequency with any accuracy, and many more to determine any change in the frequency.

It is known to have been warming for at least 150 years. If warming had resulted in more extreme weather, it might have been expected that there was some evidence for an increase in extreme events over that period. The popular press certainly tries to be convincing when an apparently violent storm arises. But none of the climatological indicators that have data going back at least 100 years show any sign of an increase in frequency of extreme events

For instance, there have been many claims that tropical cyclones are increasing in their frequency and severity.  The World Meteorological Organisation reports:  “It remains uncertain whether past changes in tropical cyclone activity have exceeded the variability expected from natural causes.”

It is true that the damage from cyclones is increasing, but this is not due to more severe weather.  It is the result of there being more dwellings, and each dwelling being more valuable, than was the case 20 or more years ago.  Over a century of data was carefully analysed to reach this conclusion.  The IPCC report on extreme events agrees with this finding.


Severe weather of any kind is most unlikely to make any part of our planet uninhabitable – that includes drought, severe storms and high winds. In fact, this is not too surprising – humanity has learned how to cope with extreme weather, and human beings occupy regions from the most frigid to the most scalding, from sea level to heights where sea-level-dwellers struggle to breath. Not only are we adaptable, but we have also learned how to build structures that will shield us from the forces of nature.

Of course, such protection comes at a cost. Not everyone can afford the structures needed for their preservation.  Villages are regularly flattened by storms that would leave most modern cities undamaged. Flood control measures are designed for the one-in-a-hundred year events, and they generally work – whereas low-lying areas in poor nations are regularly inundated for want of suitable defences.

Indeed, it is a tribute to the ability of engineers to protect against all manner of natural forces.  For instance, the magnitude 9 Tōhoku earthquake of 2011 (which caused the tsunami that destroyed the reactors at Fukushima) caused little physical damage to buildings, whereas earlier that year, the “mere” magnitude 7 earthquake in Wellington, New Zealand, toppled the cathedral.


So we should not fear extreme weather events. There is no evidence that they are any stronger than they were in the past, and we have generally adequate defenses against them.  Of course, somewhere our defenses will fail, but that is usually because of a design fault by man, not an excessive force of Nature. So here, on the fourth step of our journey, we can clearly see the climate change hypothesis stumble and nearly fall.


 .

Thursday, October 9, 2014

Anyone for a carbon tax?


Our Treasury seems wedded to the idea of a tax on carbon emissions.  In this, they are cheered on by the Department of Environmental Affairs, but the Department of Energy and the Department of Public Enterprises both seem to be having some reservations. If it is proving difficult to finance Eskom, and economically undesirable to hike the cost of power any more, why would we want to increase the power cost yet further in the vain hope of saving the planet?

It all goes back to that proud moment in November 2009, when our State President stood before the world at a gathering in Copenhagen. He offered to reduce our carbon emissions by large amounts provided the developed nations would help with the costs of the reductions.  At the time, it was seen as a noble gesture on our part.  Now, the gilt has fallen from the offer, not least because the anticipated help has been conspicuous by its absence.  The developed nations have come face-to-face with the economic downturn. Saving the planet has moved lower on the list of priorities.

There are three major things wrong with the tax idea.  First, the plan announced by President Zuma wasn’t a plan in the first place.  What he said was:
With financial and technological support from developed countries, South Africa for example will be able to reduce emissions by 34% below ‘business as usual’ levels by 2020 and by 42% by 2025.
This was a scenario from the Long Term Mitigation Scenarios, which was called “Required by Science.” Now scenarios are not plans, they are sketches of what might be possible.  Moreover, science does not require anything; it merely provides a platform for understanding.  But the Department of Environmental Affairs sprang upon the scenario with glee, believing in their zeal that science really had produced a plan out of some magic hat.  With no further thought of the implications of what they were doing, they set about trying to implement something that had every chance of not being possible. The carbon tax is part of their plan of implementation.

The second thing wrong with it is that it is an economic disaster.  Treasury evaluated the impact, and found it made the rich richer and impoverished the poor. Indeed, the impact was hardest on the poorest. To understand why it is a disaster, you need to recognize that there is a very strong relationship between economic growth and the consumption of energy.  To grow the economy, you have to provide more energy. But over 90% of South Africa’s energy comes from fossil fuels. Most of our energy gives rise to carbon dioxide emissions.  So economic growth means more energy which means more emissions.

It is possible to reduce the linkage between economic growth and energy consumption, but this cannot happen overnight.  Nowhere in the world has there been delinkage at the rate that the Long Term Mitigation Scenarios would require – and, note well, the scenarios were long-term to begin with.

It is also possible to reduce the reliance on fossil fuels.  Indeed, this is precisely what the Department of Energy’s renewable power programme is designed to do.  But even the latest Integrated Resource Plan Update would not produce the sort of drop in reliance that the Mitigation Scenario would require.

The Department of Environmental Affairs recognizes these problems, so it has come up with a different plan.  It aims to set up a carbon trading platform, which will allow companies that produce carbon in excess of some arbitrary limit (which the Department will set) to buy emission credits from companies which produce less carbon than the limit.  Treasury, advised by a group of would-be carbon traders, has agreed to this ploy. 

There are at least three objections – on Treasury’s own calculations, there is insufficient volume of tradable carbon to support such a scheme; a few industries which have found ways to save carbon have already cashed in on the various pre-existing schemes such as the Clean Development Mechanism; and, most damning of all, it would establish a bureaucracy within the Department of Environmental Affairs which could control emissions and thereby the entire economy at the merest whim. The fact that carbon trading platforms have been a disaster in the US and have cost the European Union billions in ineffective support (and lost VAT) has not been sufficient to persuade either the Department or Treasury that such a scheme is ill-advised. Treasury is doubly culpable in this – the foxy carbon traders showed it how to design a carbon henhouse, a sure-fire way to lose the chickens!

The third thing wrong with a carbon tax is that it would achieve nothing.  There seems to be some sort of zeal in our Government to save the world from a possible carbon hell.  South Africa emits around 1% of global emissions.  Suppose we were to reduce our emissions by a quarter, which would probably wreck our economy for good, the global impact would be absolutely nil. 

It might be justified if the rest of the world had similar zeal, but it demonstrably has not.  The Kyoto Protocol came into effect in 2005. In the first commitment period, 2008-12, many developed countries agreed to legally binding limits on their emissions. What happened? Well, between 2008 and 2012, global fossil fuel use went up by 8.5%, and the contribution of fossil fuels to global primary energy supply was unchanged at 87%.  Is it worthwhile committing economic suicide to protest the failure of others to observe legally binding limits?

Moreover, with every passing year the whole rationale for reducing carbon emissions is becoming weaker and weaker.  In the past 16 years, emissions have gone up 40%; global temperatures have been stationary.  Indeed, there has been only a short period in our history when the hypothesis that carbon emissions and global temperatures are linked was supportable. That was between 1970 and 1997. Before then, the world cooled as emissions increased, and since then the temperature has not changed.

Instead, a different hypothesis has emerged. This proposes that there will be more extreme weather in a warmer world.  However, it is not demonstrable.  To the contrary, it has been possible to extend many measures back to the late 1800’s. We can now see how extreme the weather was in earlier times.  Even though the world has demonstrably warmed over the past 150 years, there has been no detectable change in the frequency or severity of extreme events.  One of the surprises has been that the world has not become measurably wetter, which seemed very likely in a warmer world.

So the rationale behind a carbon tax is now very weak.  It always was weak.  The idea that a tax will encourage a change in social behaviour is seductive, but a little thought will soon show the flaws.  It was long hoped, for instance, that swingeing taxes on tobacco would reduce smoking, but it had little effect. Other laws became necessary to bring about the desired social change.  Alcohol consumption continues unabated – the annual increase in the sin tax has an imperceptible effect.  At least with tobacco and alcohol, it is possible to cut down on consumption.  Carbon, with its direct linkage to energy and wealth creation, can only be cut back by greater efficiency. Most large users of energy have already done much to improve their efficiency as far as possible.  Further improvement is up against the law of diminishing returns. 

Carbon emissions are therefore inelastic, in economic terms. Adding a cost to energy has an impact on the demand by closing otherwise profitable industries. Jobs are then lost.  It is happening in our economy right now. That is ultimately the reason why there are no grounds for taxing carbon.

Tuesday, January 21, 2014

Tricky IPICCY


In the debate about climate change/global warming, there is a lingering question – how can many apparently sensible people question the findings of the IPCC?  The Intergovernmental Panel on Climate Change is one of the shining lights in the UN’s collection of bodies. Does it not represent the consensus views of many scientists from around the world?

Sadly, it does not.  But this leads to the question - how do you determine 'consensus'? It is difficult to go round asking people if they agree - you don't know if they are telling the truth, or they may give you misleading answers.  You may slant the question or fudge the answers to get the 'consensus' you desire - which has happened in this sphere recently, as shown by the flaws in the so-called '97% consensus' story.

 I think a good way to test consensus is to see what happen if you keep asking the same question.  Ask a question, see what the response is; ask it again, and see what the response is; ask it a third time, and then compare the responses.  Are there differences over time?  If not, then you have true consensus.

This should be one way in which the IPCC finds consensus.  The drafts of it's Assessment Reports go through three drafts before being published.  Each of those drafts is reviewed by hundreds of reviewers from all over the world.  Comments are carefully logged, and summarised by review editors.  Changes are made in texts and figures. The end result is supposed to represent the consensus view.

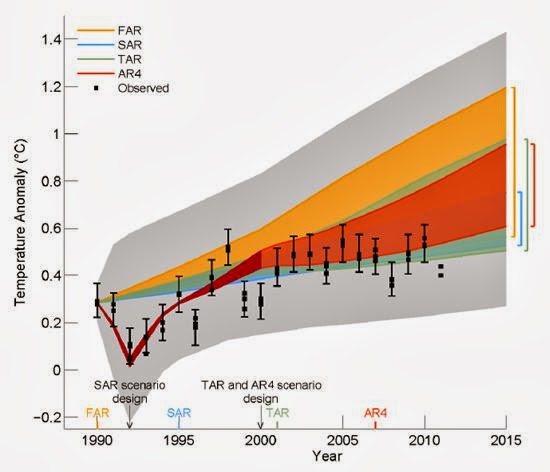
The latest IPCC Assessment Report went through the requisite three rounds of drafting. In September 2013, the report was published in final draft, “accepted by Working Group I of the IPCC but not approved in detail.”There was a key diagram in each of the first three drafts.  It showed how the most recent measurements of the global temperatures were diverging from predictions made in earlier Assessment Reports. 

In the first two rounds of drafting, the figure appeared with other figures comparing predictions to reality.  The First Order Draft, Technical Summary, TFE 3 Figure 1, p79 has it thus:-

The black dots represent the different estimates of global temperatures, the various coloured bands represent the predictions, and the grey band is supposed to represent the range of the various predictions.

The AR4 predictions were made in 2007, so by 2012 when the 2011 data was available, everyone was concerned that the measurements were well below the lower range of a prediction made only five years before. There were comments to the effect that this was an important finding, and in the third draft of AR5, the figure was moved up in importance and shown separately as Second Order Draft, Figure 1.4:-


 By time of the Third Draft, the full data for 2011 were available, and most of the data for 2012. When shown on this graph, they confirmed that the AR4 predictions were high.  So you would think consensus had been achieved.  The question as to whether this was a valid representation of the state of the science had been asked repeatedly, and the diagram had been accepted unchanged.  I and many other scientists accepted that there was a gap between what we had thought in 2007 would happen, and what by 2013 had actually happened, and were girding our loins to try to find the source of the problem.


Then September 2013 arrived, and with it the final draft:-:

The Final Draft Figure 1.4 was totally different - the scales had changed; the measurements had been slightly shifted, the predictions had been rebased,and the critical data, the comparison between reality and model, had been buried under a mound of spaghetti, being the output of a whole lot of models.  Now you could no longer see that there was a difference between model and reality, or that the earlier predictions were high. The simple message of the first three rounds of drafting had been lost. Instead somebody somewhere in the IPCC hierarchy had decided that the simple message was unacceptable, and what the scientists had shown with perfect clarity should instead be buried in a diagram of total incomprehensibility.

Governments everywhere had hoped the IPCC would provide them with sound advice. Slowly the truth is coming out - the IPCC would rather bury a simple message with sleight-of-hand than admit to an obvious shortcoming.  Tricky IPICCY indeed!


Sunday, November 24, 2013

Did they not see it coming?


The wassail in Warsaw ended yesterday.  As TS Eliot might have said:

This is the way the sea owe pea ends

This is the way the sea owe pea ends

This is the way the sea owe pea ends

Not with a bang but a whimper.


As the thousands jetted their way home, they must have wondered how this came to pass.  The rich had issued a clarion call – “Wake up! We face doom! We face destruction! The seas are arising, the storms are worsening, the globe will soon fry! We must stop this pollution. Sea owe two is bad for me and you.” The poor heard this nonsense, and pointed their fingers. “If that is true, it must be YOU! Now PAY!”


In vain did the rich argue “But it is a global problem.  We are all in this together.” They even cobbled together a  meaningless phrase, “common but differentiated responsibility”, to try to justify their claim that, while they had emitted great gobs of sea owe two, the poor must share the burden of trying to cut the world’s reliance on fossil fuels.


Now they are landed with costs for which they hadn’t budgeted. Douglas Carswell, Tory MP for Clacton, summed it up:

“We’re spending money that we don’t have to solve a problem that doesn’t exist at the behest of people we didn’t elect.”


What I have difficulty in understanding is how supposedly sentient politicians didn’t think, when they signed up to the global warming boondoggle, that because they had contributed most to the perceived problem, they would be asked to contribute most to the putative solution. Were they blind, blind drunk, or merely blinded by what they saw as a lifetime opportunity to claim that they were about to save the world?


Now the flights of fantasy are coming home. Reality is beginning to bite, and the teeth are sharp indeed. If sea owe two is a pollutant, then everyone pollutes with every passing breath. So of course it is not a pollutant, unless the word is to be redefined in some as yet mysterious way. 


Meanwhile the global warming hypothesis is looking decidedly tatty. The world steadfastly refuses to warm in the face of ever-growing sea owe two. The plants are doing just fine, the deserts are greening, and flimsy homes are collapsing under the onslaught of strong winds just as they have always done.


In the latest emanation from the Eye Pea Sea Sea, many scientists tried to warn the politicians that much of the observable warming was natural.  Would they listen?  Of course not!  They spun the message to say they were being told that sea owe two was the dominant cause of global warming.


In days gone by, rulers would shoot the messengers of bad news. Now they put a spin on the message, and hope that it will go away.  In this case, it won’t. Did they really not see it coming?

Monday, October 7, 2013

Just who are the denialists?

People have the nasty habit of giving their opponents names.  Those who are convinced that humans are wrecking the world by burning fossil fuels call those who don't believe them "denialists." It implies that they are close to the Holocaust deniers, and so are clearly beyond the pale.

I have come to the conclusion that they are wrong. The true denialists are those who believe in global warming, and who will go to any lengths to deny the evidence against that position.

For instance, this last week has seen the release of the final draft of the IPCC's Working Group 1.  Working Group 1 concerns itself with observations of the climate and how it might change in future.  

Within minutes of it being released, the sceptics had noted that a key figure, which compared predicted temperatures to measurements, had been drastically altered after the second draft had been approved.  In the second draft, the observations lay below the lowest range in the predictions, and seemed to be getting further from the predictions as time went by.  In the final version, the measurements had been pushed up and the predictions had been pushed sideways and Voila!, the revised measurements now fell within the range of the changed predictions.  Really!  Grown men did this!  Consciously! And honestly thought that no-one would notice.  

That's the trouble with calling people names.  Before you know where you are, you have convinced yourself that they are stupid, too.

And there were lots of similar examples.  In the Summary for Policy Makers, the scientists had said "It is extremely likely that more than half of the observed increase in global average surface temperature from 1951 to 2010 was caused by the anthropogenic increase in greenhouse gas concentrations and other anthropogenic forcings together."  The politicians did not like this, so they added a juicy version "It is extremely likely that human influence has been the dominant cause of the observed warming since the mid-20th century." Suddenly "more than half" had become "dominant cause." That way, no one might be left with the idea that the scientists had actually said there was a reasonable chance that quite a lot of the warming was entirely natural. 

My own contribution concerned the warming of the upper troposphere.  In the previous Assessment Report, the IPCC had said "Upper-tropospheric warming reaches a maximum in the tropics and is seen even in the early-century time period. The pattern is very similar over the three periods, consistent with the rapid adjustment of the atmosphere to the forcing. These changes are simulated with good consistency among the models." They even had some figures to show just what they meant:


These are sections through the atmosphere, from the South Pole on the left to the North Pole on the right. Instead of altitude they give the pressure in 'hectoPascals" which is sort of unfamiliar to most people, but 400 is around 8km up and 200 around 12km.You can clearly see the flattened 'bubble' getting hotter as the century goes by.  The models suggest that that bit of the atmosphere should warm at about 0.6 degrees Centigrade per decade, far faster than on the surface of the Earth.

Weather balloons have flown into that region for 60 years.  Airliners have carried commuters at those altitudes for 40.  The temperature can be inferred from satellite measurements.  None of these methods have managed to find any evidence of warming at anything like 0.6 degrees Centigrade per decade.  The thermometers suggest slight cooling; the satellites slight warming.


This huge discrepancy between model and measurement has been the subject of intense discussion since the 2007 Assessment.  When I read the first draft of the latest report, I said "Heh! You haven't mentioned the problem!" Along came the second draft - same difficulty.  This time I read out to the IPCC the actual papers from the peer-reviewed literature that they should be using -  
Allen, Robert J. and Sherwood, Steven C. (2008) Warming maximum in the tropical upper troposphere deduced from thermal winds. Nature Geosci 1 (6), 399- 403, http://dx.doi.org/10.1038/ngeo208; 
Lanzante, John R., Melissa Free, 2008: Comparison of Radiosonde and GCM Vertical Temperature Trend Profiles: Effects of Dataset Choice and Data Homogenization. J. Climate, 21, 5417–5435. doi: http://dx.doi.org/10.1175/2008JCLI2287.1;  
Singer, S Fred, (2011). Lack of Consistency Between Modeled and Observed Temperature Trends Energy & Environment, 22, 375-406 DOI  - 10.1260/0958-305X.22.4.375 ; 
Douglass, D. H., Christy, J. R., Pearson, B. D. and Singer, S. F. (2008), A comparison of tropical temperature trends with model predictions. Int. J. Climatol., 28: 1693–1701. doi: 10.1002/joc.1651
Titchner, Holly A., P. W. Thorne, M. P. McCarthy, S. F. B. Tett, L. Haimberger, D. E. Parker, 2009: Critically Reassessing Tropospheric Temperature Trends from Radiosondes Using Realistic Validation Experiments. J. Climate, 22, 465–485. doi: http://dx.doi.org/10.1175/2008JCLI2419.1
(I mean, how pedantic do you have to be?)

I concluded my review saying "not even the satellite data comes near the predictions that were made in AR4 - the discrepancy between ALL the data and the models is wide. This debate MUST be reflected in the text."  So the IPCC had been told where to look - it is their job to review the peer-reviewed literature - and had been told that there was a debate because the measurements disagreed with the models. What did they do?

Nothing!  Absolutely nothing (apart from quoting Titchner in a different context). The Summary for Policy Makers says:
"It is virtually certain that globally the troposphere has warmed since the mid-20th century. More complete observations allow greater confidence in estimates of tropospheric temperature changes in the extratropical Northern Hemisphere than elsewhere. There is medium confidence in the rate of warming and its vertical structure in the Northern Hemisphere extra-tropical troposphere and low confidence elsewhere."
Section 2.4.4 says:
"In summary, assessment of the large body of studies comparing various long-term radiosonde and MSU products since AR4 is hampered by dataset version changes, and inherent data uncertainties. These factors substantially limit the ability to draw robust and consistent inferences from such studies about the true longterm trends or the value of different data products."
So the data were apparently wrong! 

There is a Table 2.8 headed:
"Trend estimates and 90% confidence intervals (Box 2.2) for radiosonde and MSU dataset global average
values over the radiosonde (1958–2012) and satellite periods (1979–2012). LT indicates Lower Troposphere, MT
indicates Mid Troposphere and LS indicates Lower Stratosphere"
Notice that?  No Upper Troposphere - none, silence! Likewise, there is a Figure 2.24 which shows some Lower Troposphere trends, but is equally silent on the Upper Troposphere. 

And that is the full extent of the discussion of the problem in the latest Report.

Now you could well ask "So what?" The significance is that this goes to the heart of the physics on which all the models used to make predictions are based. If you watched "The Great Global Warming Swindle," you will have seen the critic, Richard Lindzen of MIT, speaking about how the Upper Troposphere should be warming.  The physics of the atmosphere, as generally understood by all scientists of whatever global warming persuasion, require it should be warming.  There is consensus - but the data show the consensus to be wrong.

Therefore the models are wrong.  It only takes one clearcut observation to destroy the integrity of a scientific thesis. The physics underlying all the models is wrong - and we don't know why. Moreover, the IPCC is demonstrably skirting the issue, telling us that "the observations substantially limit the ability to draw robust and consistent inferences."  What utter nonsense!  They lie.

By any measure, the IPCC and its supporters are the true denialists, but it would be wrong of me to use such a word to describe them. So let's just use a good, old-fashioned word - call them liars, and have done with it. 


Sunday, February 10, 2013

A climate of scepticism - Part III


In this final part of my climate paper, I talk about extreme events and other scare stories, and about how some scepticism is the result of the excessive zeal of climate change proponents.

Disasters that have nothing to do with a changing climate are ascribed to “climate change” as a means of raising awareness about the supposed threats. Nothing illustrates this aspect of the debate better than the ongoing accent on “extreme events.” A violent storm, such as the recent Sandy that struck New York, is immediately seized upon as evidence of “climate change.”

Weather is ever variable. The vigour of every natural phenomenon has a wide range. Many phenomena, for example rainfall, are best described by a distribution which is very strongly skewed.  Such distributions are quite counterintuitive when it comes to trying to define what constitutes “extreme”.

The problem is how to decide the width of the ‘normal’ range, a decision essential for describing an event as abnormal or ‘extreme’, that is, lying outside the normal range.   A lot of data is necessary to define ‘normal’, which implies that data must be collected over a long period. The long period may exceed a human lifetime.  If so, then few living individuals can have experienced the truly “extreme” events – and an event much less than extreme may be seized upon as an example of an extreme event when in fact it is no such thing.

In the case of storm Sandy, there has been an assessment of the intensity of all hurricanes and “post-tropical storms” (of which Sandy was one) that made landfall on the continental United States between 1900 and 2012. The data are shown in Figure 8[i].

A person born in 1900 would probably have experienced their most extreme event in 1936.  However, that person might have lived to the age of 106, and would have seen two stronger storms. That might have convinced him/her that the world was getting worse.  He/she would have been wrong, of course – the random nature of extreme events would have fooled them. 
Figure 8.  Power dissipation index of storms which made landfall on the US, 1900-2012
This illustrates quite nicely how long one must wait before one can determine even the 100-year event – and how just because there has been such an event, another nearly as bad can turn up in less than 100 years after that! The statistics of extreme events are counterintuitive, and very long baselines are needed before it is possible to decide if something is extreme or not.

There has been extensive concern about extreme events, partly because almost every day somewhere on the globe there will be an event that might be describable as ‘extreme’. The IPCC has issued a special report on the subject[ii]. It can probably best be described as ‘delphic’ – a series of very cautious pronouncements that can be interpreted in different ways, depending on your viewpoint. Probably the best measure of the extent to which extreme events should be viewed as likely to be caused by climate change comes from a study of deaths caused by severe weather[iii].  The results are shown in Figure 9.

It is clear that the absolute number killed each year has dropped since the 1920’s.  In relative terms, the drop has been even more dramatic, from a peak of 241 per million to 5 per million.  At this low rate, extreme weather no longer presents the same risks as faced previous generations.


Figure 9. Deaths and death rates per million people from extreme weather events
 The reasons for this steep decline are several.  One is vastly better weather prediction, so that there is now adequate warning about possible extreme weather conditions.  Secondly, there is much better communication of impending severe weather. Finally, with improved knowledge of severe conditions, mankind has learned to design structures that protect us from the hazards. If ‘climate change’ is having any effect, it is invisibly by this measure.


The final scare story that needs to be laid to rest is that of species extinction as a result of climate change. The popular press reports this regularly. “’Climate change now represents at least as great a threat to the number of species surviving on Earth as habitat-destruction and modification,’ said Chris Thomas, a conservation biologist at the University of Leeds in the United Kingdom. - - the predicted range of climate change by 2050 will place 15 to 35 percent of the 1,103 species studied at risk of extinction. The numbers are expected to hold up when extrapolated globally, potentially dooming more than a million species. ”[iv] 


However, science prefers predictions that are testable. A recent serious study concluded that “Surprisingly, [there is no] straightforward relationship between local extinction and limited tolerances to high temperature.” [v] Indeed, this follows from common sense.  Figure 10 shows the average monthly conditions for Cape Town. The boxes show the average daily maxima and minima, the lines show the highest and lowest temperatures ever recorded, and the lower and upper horizontal lines reflect the annual average temperature in 1900 and 2000 respectively. 
Figure 10. Monthly temperatures in Cape Town, and annual averages in 1900 and 2000
It is reasonable to ask how the relatively small average temperature change can be detected by organisms that every year are likely to be exposed to changes some 50 times larger, to which they seem perfectly adapted.


The final reason for ongoing scepticism is the behaviour of some of the proponents of the climate change thesis.  It starts with the Intergovernmental Panel on Climate Change.  It has become a political body rather than a technical body.  The best illustration of this is the publication of the Panel’s reports.  It is preceded by the publication of a summary for policy makers. This summary often differs in material respects from the findings of the main report, and invariably puts a politically correct slant on what is supposed to be a dispassionate review of the scientific literature[vi]. 


The IPCC’s work is not aided by the fact that much of the work reported is not scientific, but reproduced from activist literature.  The Canadian journalist Donna Laframboise has documented this problem in detail[vii].


For example, she tracks how a relatively unknown professor of epidemiology, Anthony McMichael, who had written a polemic in 1991, became a lead author of the chapter on malaria and the health effects of climate change, even though he had no professional publications about malaria and even though some of his conclusions were rejected by members of the Panel who were world experts on the subject. 


Sections of McMichael’s book appeared almost verbatim in the IPCC’s Assessment Report in 1995. This led directly to the thesis that global warming will increase the spread of malaria. There is no evidence that this is likely, because malaria has been known in cold climates for centuries. Moreover, the spread of malaria is known to be almost entirely a function of social conditions and public health.


The fight against malaria is not helped by those who claim that climate change is part of the problem. If they had their way, the accent would be on addressing climate change rather than fighting malaria. This illustrates a danger of accepting a possibly flawed thesis too uncritically – resources may be diverted from essential activities affecting the lives of millions in the hope that there will be a positive impact on putative risks that might possibly affect billions.  Before taking such a decision, one needs to be very certain indeed that the putative risks can be avoided by the diversion of resources.


Another reason for scepticism is that the debate about climate change has revealed some major imperfections in the scientists themselves. Some players on the human-induced climate-change playing field have shown themselves to be only too human in the defence of the indefensible. For example, two scientists did what scientists are supposed to do – they peer-reviewed the work of some 200 other scientists[viii].  They reported that:

“Across the world, many records reveal that the 20th century is probably not the warmest nor a uniquely extreme climatic period of the last millennium.”

This was totally contrary to the thesis that today’s warming was exceptional. Accordingly the believers in human-induced change forced the editor of the journal that had published the review to resign, and went out of their way to try to destroy the reputations of the two authors.  All this (and more) was revealed when a series of emails found its way into the public domain from the Climate Research Unit at the University of East Anglia[ix].


The world is slightly warmer than a century ago.  The carbon dioxide levels of the atmosphere are increasing.  Plants are doing better than before because of the higher carbon dioxide[x]. The sea is rising in a barely detectable way. Climatic disasters are no worse than previously. The animal kingdom is being squeezed by the growth of a single species, us, but that has nothing to do with global warming.


And that is why there is a climate of scepticism.


[ii] IPCC, 2012: Managing the Risks of Extreme Events and Disasters to Advance Climate Change Adaptation. A Special Report of Working Groups I and II of the Intergovernmental Panel on Climate Change [Field, C.B. et al (eds.)]. Cambridge University Press, Cambridge
[iii] Goklany, I.M. Wealth and Safety: The Amazing Decline in Deaths from Extreme Weather in an Era of Global Warming, 1900–2010. Reason Foundation, Washington DC and Los Angeles, CA, 2011
[v] Cahill, A.E, Aiello-Lammens, M.E., Fisher-Reid, M.C., Hua, X., Karanewsky, C.J., Ryu, H.Y., Sbeglia, G.C, Spagnolo, F., Waldron, J.B., Warsi, O. and Wiens, J.J. How does climate change cause extinction? Proc. Royal Soc. B 2012 doi: 10.1098/rspb.2012.1890
[vii] Laframboise, Donna The Delinquent Teenager who was mistaken for the world's top climate expert. Ivy Avenue Press, Toronto 2011. ISBN: 978-1-894984-05-8
[viii] Soon, W. and Baliunas, S. Proxy climatic and environmental changes of the past 1000 years. Climate Research Vol. 23, pp89–110, 2003